Graphene is a new Ruby gem for transforming collections of Ruby objects into subtotals, percentages, tables and graphs. See the source code at github.com/jhollinger/graphene and read the full documentation at jordanhollinger.com/docs/graphene.
While the things Graphene does aren’t particularly difficult, they are repetitive and annoying enough that I wanted a quicker, DRYer way of doing them. So here’s my attempt. Let me know if it’s useful to you or can be improved.
Calculations
logs = SomeLogParser.parse('/var/log/nginx/access.log.*')

# Calculate percentages
puts Graphene.percentages(logs, :browser)
=> [["Firefox", 40.0], ["Chrome", 35.0], ["Internet Explorer", 25.0]]

# Calculate on combinations of attributes
percentages = Graphene.percentages(logs, :browser, :platform)

puts percentages
=> [["Chrome", "OS X", 40], ["Internet Explorer", "Windows", 25], ["Firefox", "Windows", 25], ["Firefox", "GNU/Linux", 8], ["Chrome", "GNU/Linux", 2]]

percentages.each do |browser, platform, percent|
  # Do stuff
end

# Calculate subtotals
puts Graphene.subtotals(logs, ->(log) { log.browser.downcase })
=> [["firefox", 600], ["chrome", 525], ["internet explorer", 375]]

# Add an X axis
Graphene.percentages(logs, :browser).over(:date)
=> {#<Date: 2012-07-22> => [["Firefox", 45], ["Chrome", 40], ["Internet Explorer", 15]],
    #<Date: 2012-07-23> => [["Firefox", 41], ["Chrome", 40], ["Internet Explorer", 19]],
    #<Date: 2012-07-24> => [["Chrome", 50], ["Firefox", 40], ["Internet Explorer", 10]]}
Tablize
puts Graphene.percentages(logs, :browser, :platform).tablize
=> +-----------------+------------+----------+
   |     Browser     |  Platform  |Percentage|
   +-----------------+------------+----------+
   |Firefox          |Windows     |50.0      |
   |Internet Explorer|Windows     |20.0      |
   |Safari           |OS X        |20.0      |
   |Firefox          |GNU/Linux   |10.0      |
   +-----------------+------------+----------+
Gruff Graphs
This is the primary purpose of this library. I find Gruff’s documentation to be lacking. You have to dig through the code to find all of the available graph types and their options. And for some charts, the task of converting your objects into the proper numerical arguments is quite tedious. I’ve tried to fix all that.
Graphene supports Gruff’s pie charts, bar charts, stacked bar charts, side bar charts, side stacked bar charts, accumulation bar graphs, spider graphs, line graphs, net graphs and dot graphs.
Sample pie chart
# Create a pie chart of browser share
Graphene.percentages(logs, :browser).pie_chart('/path/to/graph.png', 'Browser Share') do |chart|
  # Optional block to customize Gruff's chart options
end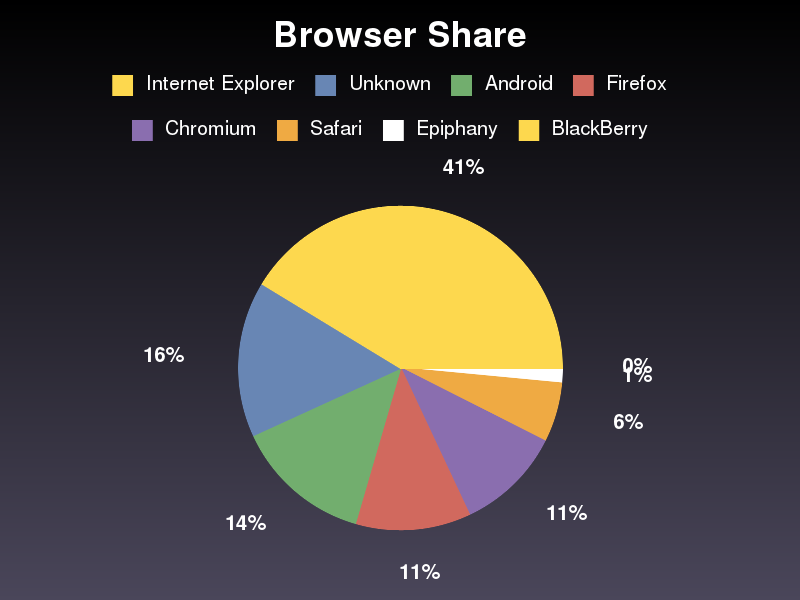
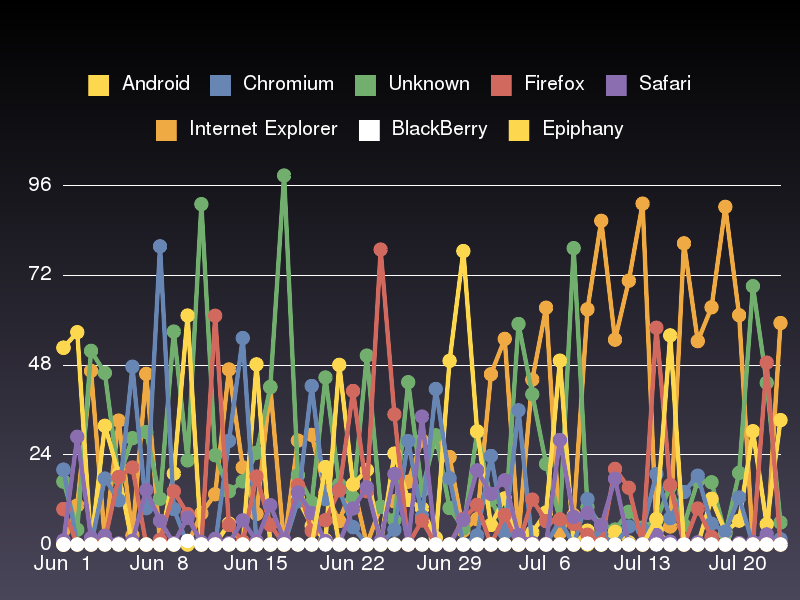
Sample line graph
# Create a line graph of browser share over time
Graphene.subtotals(logs, :browser).over(:date).line_graph('/path/to/graph.png') do |chart, labeler|
  # Optionally customize chart settings

  # Optionally customize the labels.
  # This says to only print every 7th label, and format them as "Month Day"
  labeler.call(7) do |date|
    date.strftime('%b %e')
  end
end